> For the complete documentation index, see [llms.txt](https://tradingbox.gitbook.io/use/llms.txt). Markdown versions of documentation pages are available by appending `.md` to page URLs; this page is available as [Markdown](https://tradingbox.gitbook.io/use/chao-ji-gong-ju-tao-jian/shi-chang-xing-wei-tou-shi/xie-bo-mo-shi-2.0.md).
# 谐波模式(2.0)
{% hint style="success" %}
***谐波是一种自然法则的几何比例,算法可自动识别谐波理论的13种谐波模式并标注在图表上,用户可一目了然的对市场行情走势做出判断。***
{% endhint %}
### 算法可自动识别并标注的谐波模式包括:
* [x] **Gartley Pattern 加特利形态 ;**一种常见的谐波形态,通常代表潜在的价格反转点。
* [x] **Crab Pattern 螃蟹形态;**一个谐波形态,用于识别强烈的市场反转点。
* [x] **Deep Crab Pattern** 深蟹形态;与螃蟹形态类似,但BC段较长。用于识别反转。
* [x] **Bat Pattern** 蝙蝠形态;通常代表市场的深度回调。
* [x] **Butterfly Pattern** 蝴蝶形态;通常用于识别市场的价格反转点。
* [x] **Shark Pattern** 鲨鱼形态;识别市场的潜在反转点。
* [x] **Cypher Pattern 赛福**形态;代表市场的反转点。
* [x] **3 Drive Pattern** 三驱形态;由三个等距的价格波动组成。
* [x] **5-0 Pattern 五零**形态;通常用于识别市场反转点。
* [x] **ABCD Pattern** ABCD形态,代表市场价格的简单等距移动。
* [x] **AB=CD Pattern** AB=CD形态;类似于ABCD形态,但更加严格。
* [x] **ABCD Extension Pattern** ABCD延伸形态;代表市场价格的延伸移动。
* [x] **Double Top Pattern** 双顶形态;代表市场价格的反转点。
* [x] **Double Bottom Pattern** 双底形态;代表市场价格的反转点。
{% hint style="info" %}
***即使用户不了解谐波理论也可根据算法自动标注的标签颜色 迅速对行情涨跌进行判断,红色标签代表看跌,绿色标签代表看涨!***
{% endhint %}
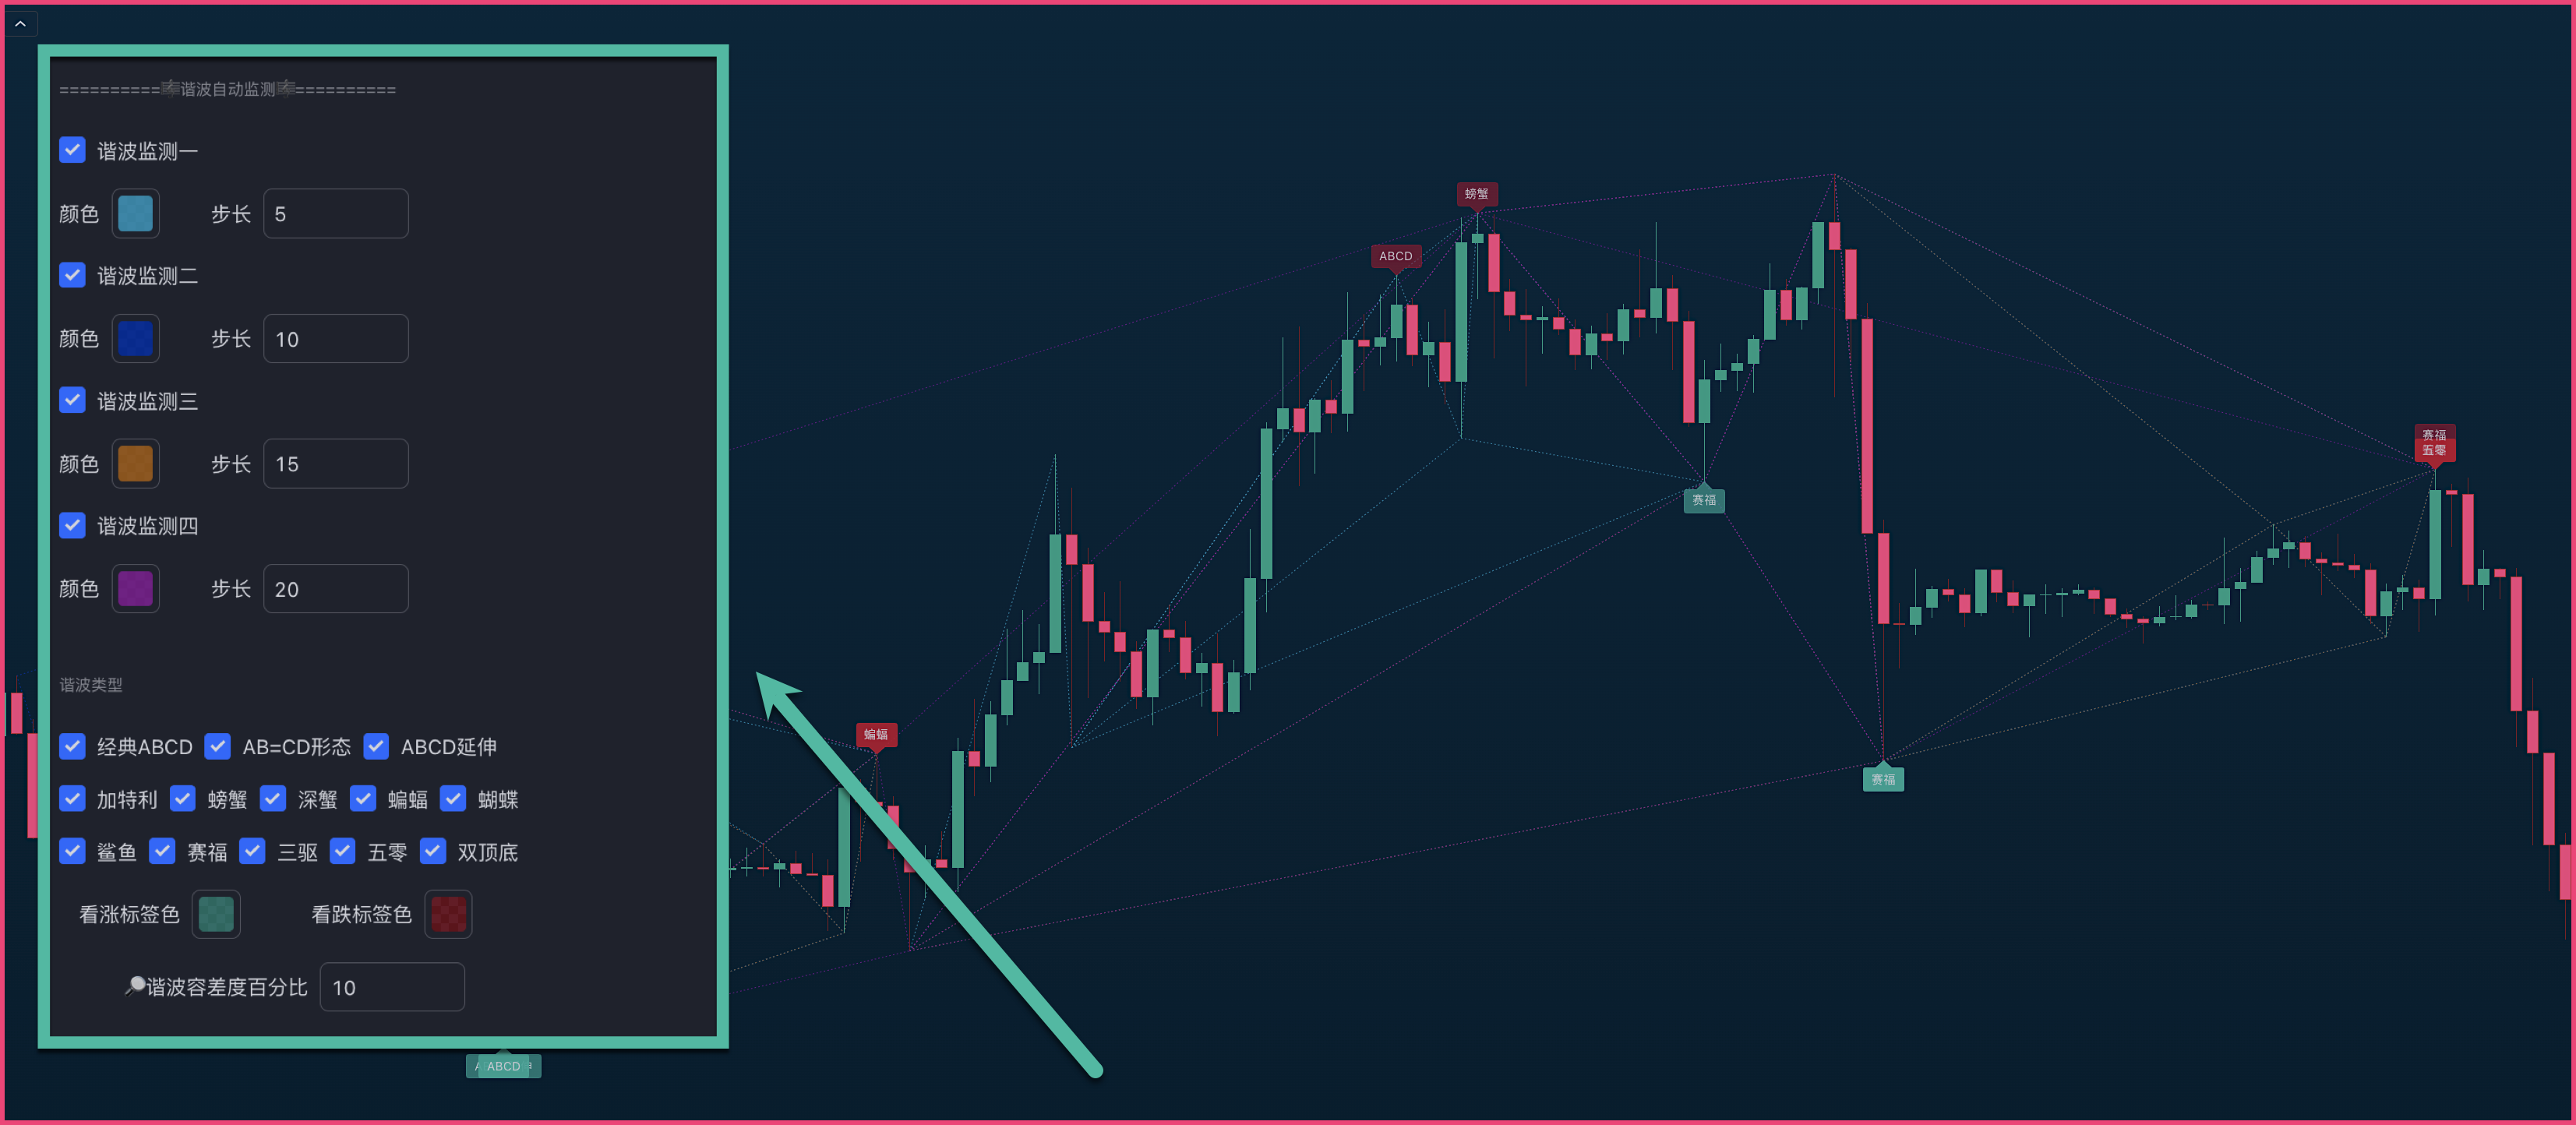
谐波版面
{% hint style="info" %}
***用户可设置四个不同周期的谐波回溯检测;同时可调整谐波检测的容差率。***
{% endhint %}
***
***